Java
Applets
FP101 - A Gentle
Introduction to the Art of Investment and Retirement Planning
Investing for the future is serious business, but
it can also be fun! We developed FP101 as a tool to help our friends and
family members understand the basic principles of investing and retirement
planning. The applet allows the user to quickly investigate a variety of
investment strategies and their retirement implications. The primary goal
of the program is to answer the question "How long can I afford to live
before the money runs out?"
It can also be used to understand the following important
facets of financial planning.
-
The crucial role played by inflation.
-
The "rule of 72," a quick and easy way to predict the
future value of an asset.
-
The extraordinary effect of time on the appreciation
of investments.
-
The importance of investing early in life.
Diagram 1 - Screen capture of the fp101 applet (to try it out, click here)
EZField
EZField is an interactive simulation that allows
the user to explore the beautiful and fascinating world of electricity.
The applet offers a variety of tools for visualizing the electric and potential
fields surrounding charged objects. It can display
-
the strange, web-like patterns formed by electric field
lines,
-
the concentric, blob-like patterns formed by electrical
potential lines,
-
a colorful topological map showing the "hills" and "valleys"
of the electrical potential field,
-
a 3D "rubber sheet" view of the potential field, and
-
a "compass field" view of the electric field highlighting
its vector nature.
The applet uses animation to demonstrate the graceful
dance of charged particles acting under mutual forces of attraction and
repulsion. In a special "finger painting" mode, the user can watch while
charges trace out interesting patterns resembling overlapping trails left
behind by red and black worms.
One other phenomenon that can be simulated by the
applet is the behavior of electric charges that are constrained to move
around on the surface of a conductor. As an oppositely-charged "magic wand"
is brought close to the conductor, the applet shows how the conductor-bound
charges rearrange themselves to get as close to the wand as possible.
Diagram 2 - Screen capture of EZField's "Symmetric
Free Charges" mode (to try it out, click here)
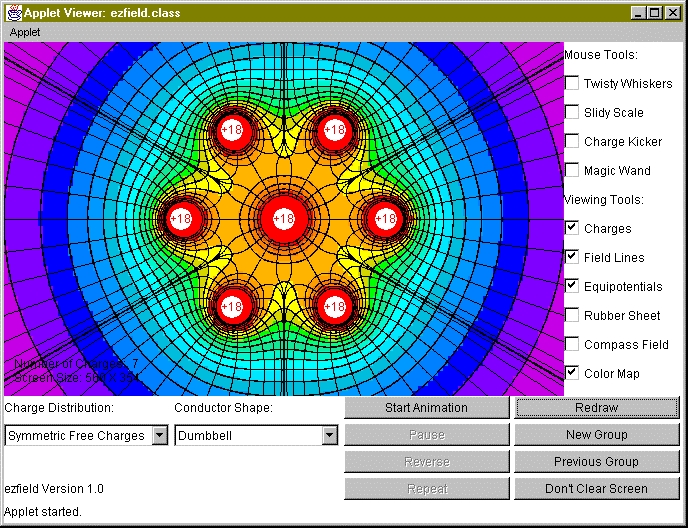
This figure shows the electric and potential field
that would surround seven symmetrically arranged positive charges. The
lines radiating outward are field lines, the concentric closed curves are
equipotential lines, and the color-coding indicates the relative height
of the potential field (regions of highest potential are red; regions of
lowest potential are violet).
Diagram 3 - Screen capture of EZField's "finger
painting" mode
This diagram shows the paths followed
by four charges moving in response to mutual forces of attraction and repulsion
(the two positive charges are red; the two negative charges are black).
Diagram 4 - Screen capture of EZField's "3D Conductor"
mode
This diagram shows a cluster of negative
charges on the surface of a dumbbell-shaped conductor congregating as closely
as possible to the oppositely-charged "magic wand," which can be moved
around using the mouse.
CoreSim - A Poor
Man's Reactor Core Simulation
CoreSim uses animation to simulate the motions and
interactions of neutrons in a nuclear reactor core. It allows the user
to control key parameters such as the numbers and locations of fuel and
control rods, the boron concentration in the coolant, and several physical
constants (e.g. fission capture probability and moderator absorption probability)
in order to explore the behavior of the system.
Diagram 5 - Screen capture of the CoreSim applet (click here to learn more about CoreSim)
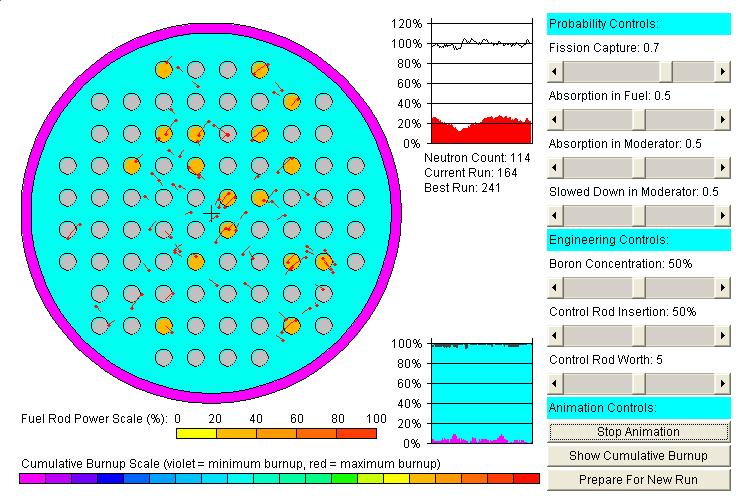
This diagram is a snapshot of an active
core containing 114 neutrons (red dots). The "tails" on the neutrons indicate
their speed and direction. The gray circles represent fuel rods, and the
blue material in between is the coolant (water). Whenever a fission event
occurs inside a fuel rod, the rod flashes yellow. The "neutron population
strip chart" (top right) shows how the total neutron population is changing
with time. The "neutron history strip chart" (middle right) shows a comparison
between the number of new neutrons created in fission events (red), the
number of neutrons which leak out of the core (green), and the number
of neutrons which are absorbed in the coolant (blue). The "change core
parameters" window allows the user to dynamically adjust several key parameters
using sliders.
Java Graphics
Template - An Artistic Introduction to Java Graphics and Animation
This applet was designed as a vehicle for
introducing my co-workers to the Java language. The template provides a
variety of standard controls, and allows the user to create a customized
graphics application which may include animation. Let your imagination
run wild!
Diagram 6 - Screen capture of the JGT applet
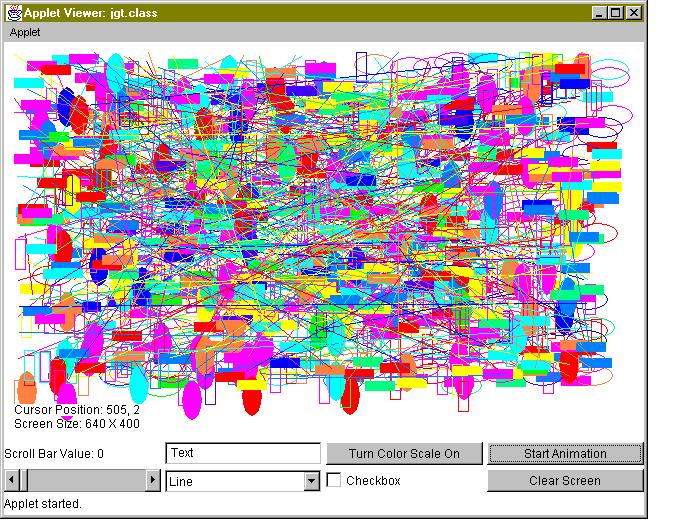
The pull-down menu allows the user to
choose a variety of drawing shapes (lines, empty and filled rectangles,
empty and filled ovals). When the animation button is clicked, the applet
starts drawing the chosen shape at random positions all over the screen
until the button is clicked again. The scroll bar allows the user to select
one of 20 colors.
SkinDose - A
Visual Basic Application to Calculate Radiation Doses Resulting From Skin
Contamination
The application calculates shallow and
deep skin doses and dose equivalent rates using a novel methodology developed
at Los Alamos National Laboratory. The user must input the following information:
-
type of skin dose to be calculated (deep or
shallow)
-
radionuclide deposited on the skin,
-
total source activity,
-
total surface area exposed, and
-
duration of exposure.
The user may save the output data to an ASCII
text file.
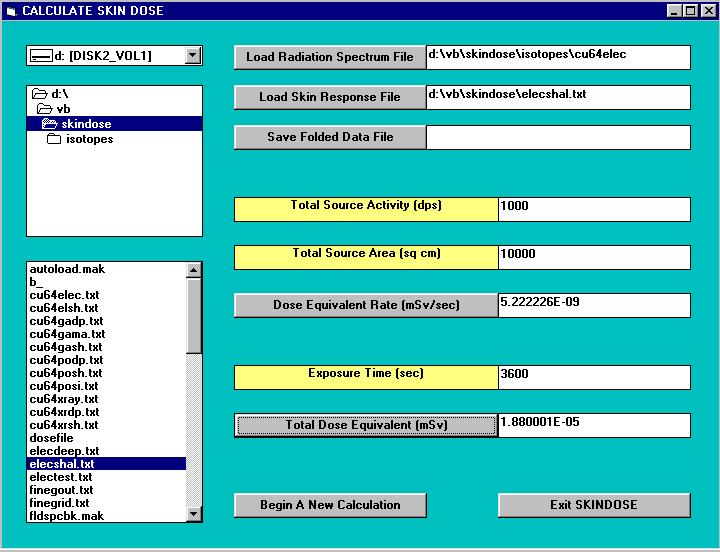
Diagram 7 - Screen capture of the SkinDose application
Collider - A
Visual C++ Application to Simulate the Redistribution of Kinetic Energy
Resulting From Collisions Between Gas Molecules
The application allows the user to specify
an input file containing a kinetic energy probability distribution, then
simulates a sequence of inter-molecular collisions. As the kinetic energy
is exchanged, the program graphs changes in the energy distribution.
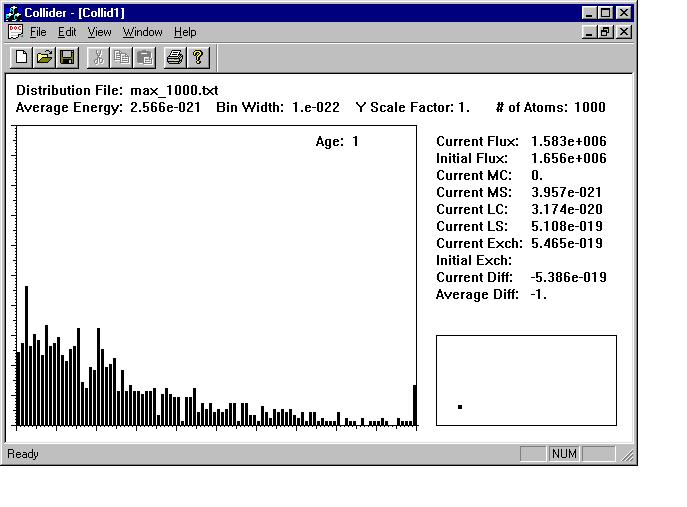
Diagram 8 - Screen capture of the Collider application
Return to
Resumopoly Page